Search Console's multi-country filter: track a cluster by market
Search Console now sums several countries in one view. Use it to track a topic cluster per market, and keep big and small markets apart when you read position.

Search Console's multi-country filter lets you tick several countries in the Performance report and read them as one total. If you track a topic cluster across markets, that gives you a free per-market scoreboard: one URL folder, one country group, a few numbers a week. The catch is average position. Merge a big market with a small one and the big one sets the number, so read each market group on its own and check clicks and impressions before you trust position.
What changed in the Performance report
On October 6, Google Search Central announced the change on LinkedIn: "Today we're updating the Search Console performance report filters to make it easier for you to analyze traffic patterns across different countries and devices. If you operate in multiple countries, you can now view their combined Google Search traffic."
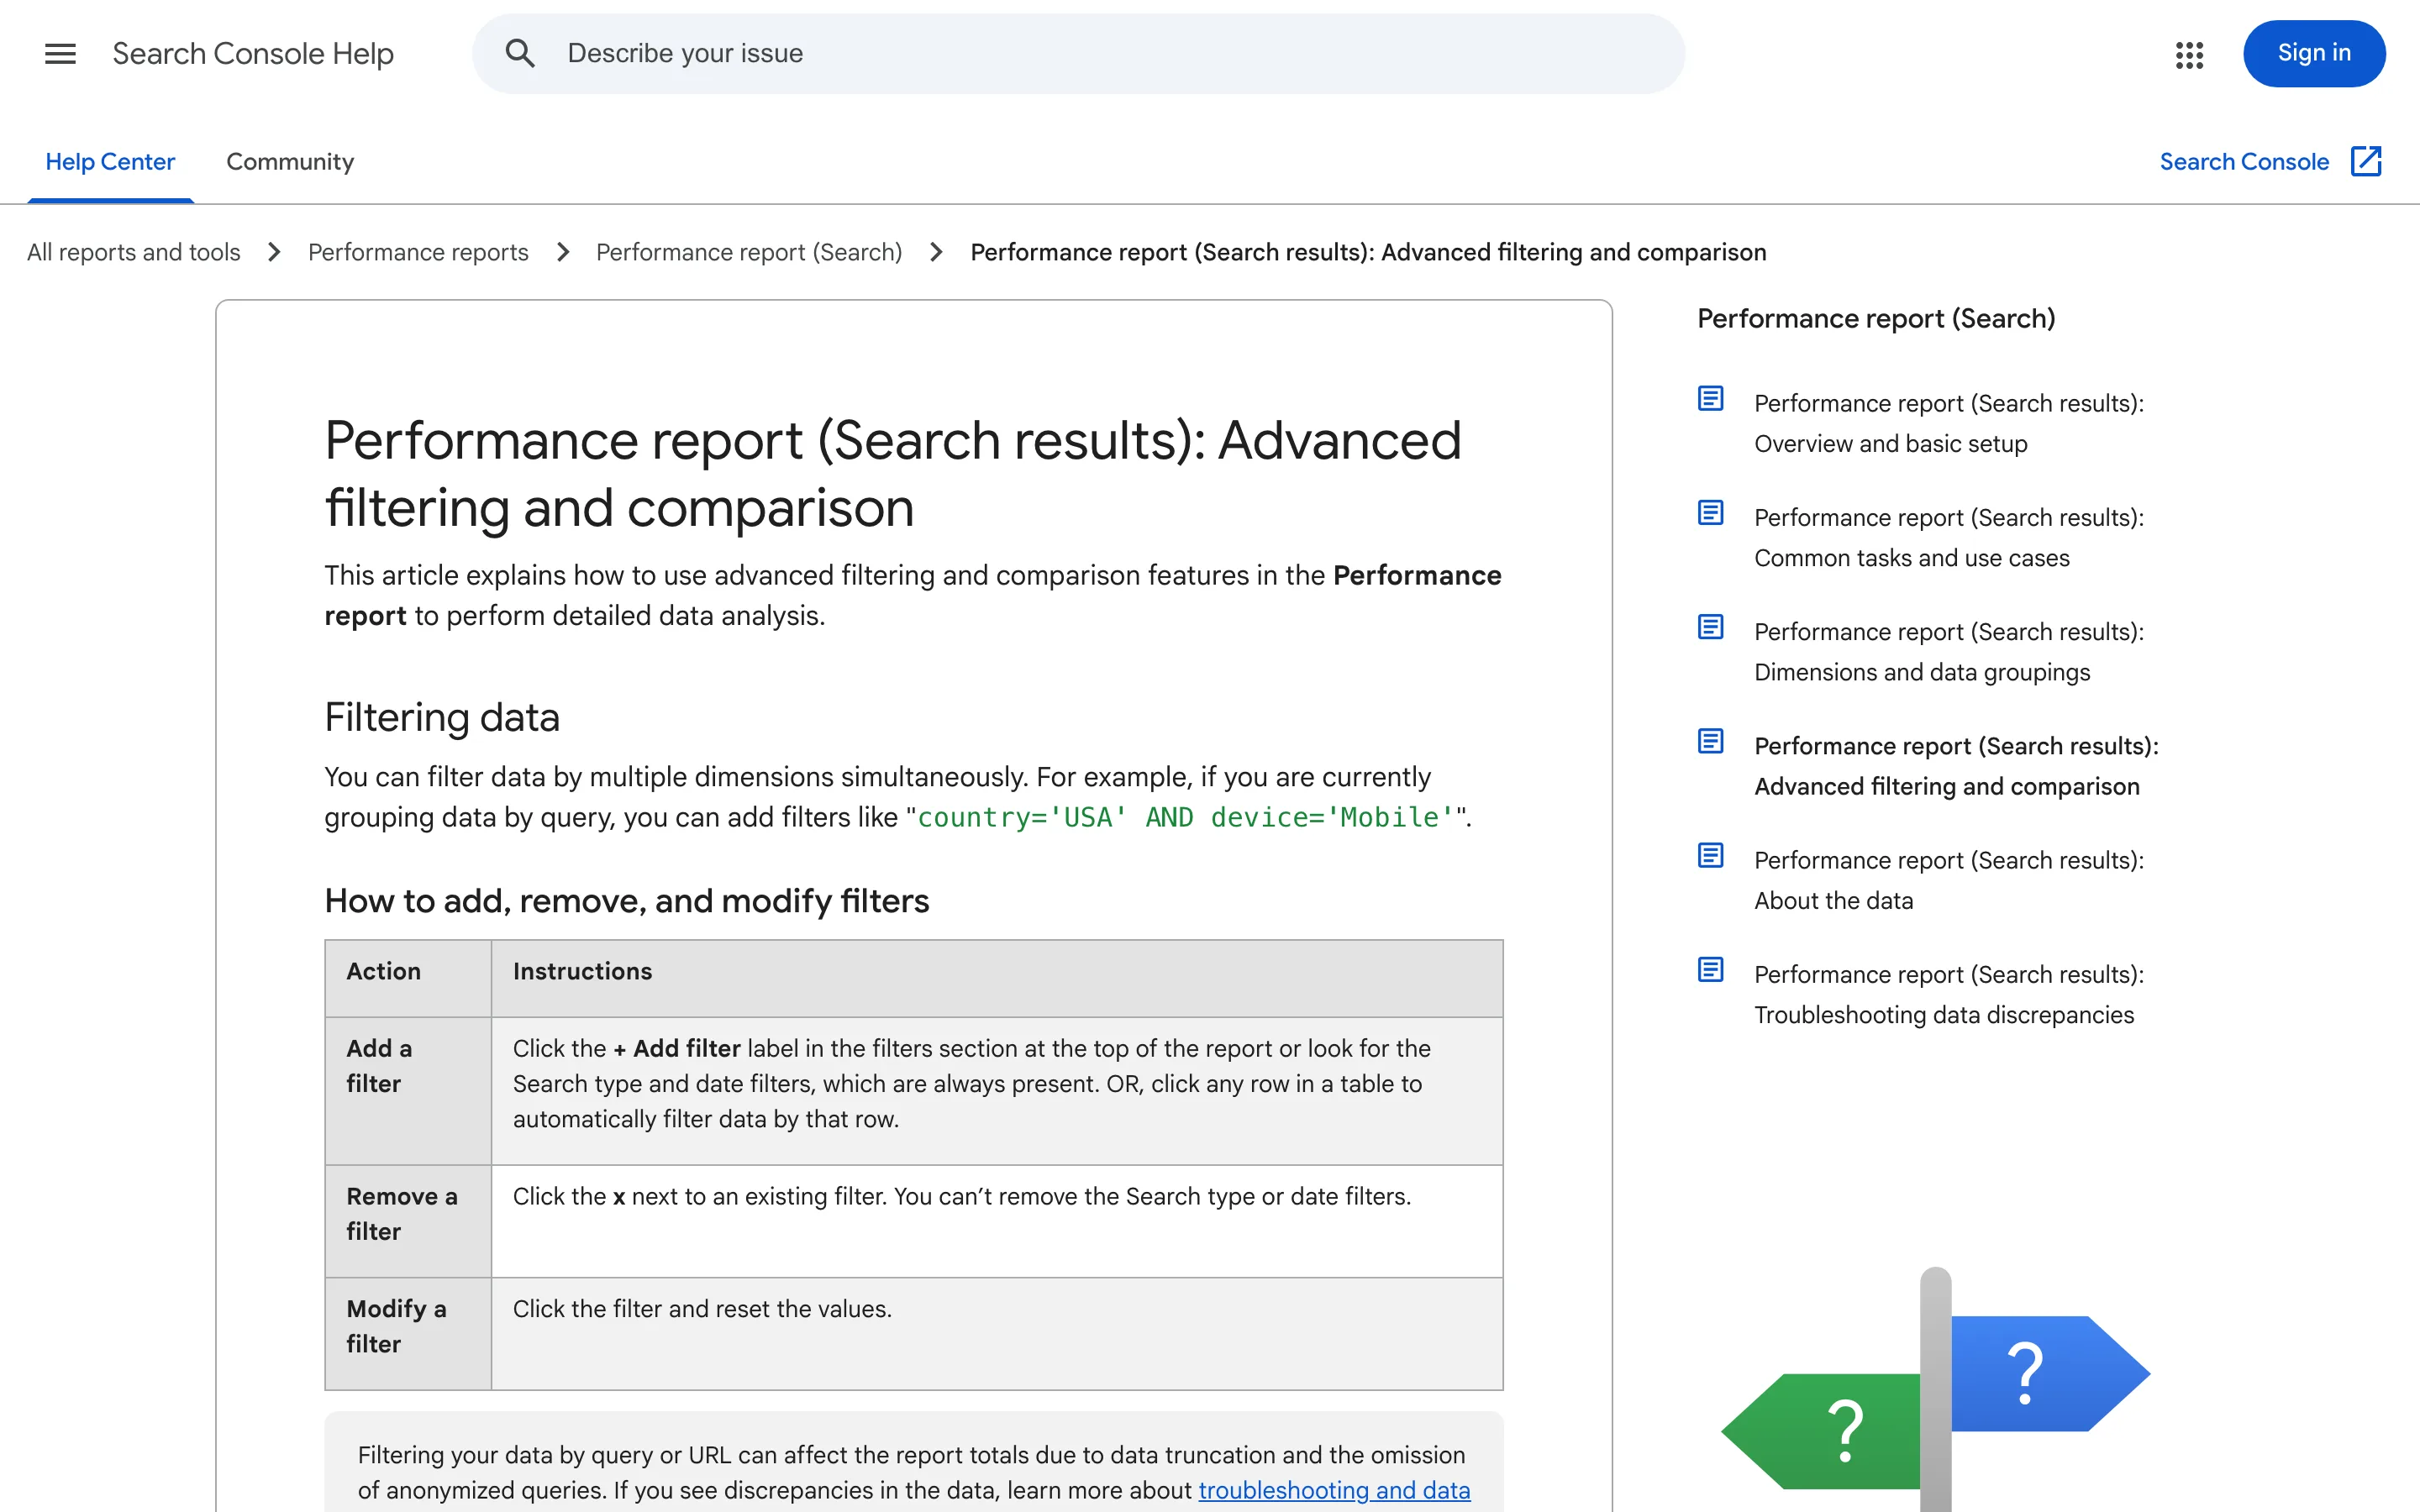
Google's help article on advanced filtering and comparison now says it in one line: "You can filter by multiple countries or devices to see their combined data." Before this, the closest you got was comparing two countries side by side and adding up the rest in a spreadsheet.
Two things the announcement left out. Google didn't say how CTR and average position are worked out for a merged selection, a gap PPC Land flagged the same day. And it didn't mention the Search Console API or Looker Studio, so assume anything you pull by API still arrives one country per row.
Why the filter matters for topic cluster tracking
A cluster that lives in one URL folder is easy to pull out of Search Console with a page filter. Our guide to rank tracking for a topic cluster ends each week with four cells: date, median position, top-10 count and folder impressions. Until this month, those folder impressions came as one global number or one country at a time.
Now the folder and a group of countries fit in one view. Say you sell in the US, the UK, Canada and Australia, and separately in Germany, Austria and Switzerland. Two saved views, one per group, each filtered to the cluster's folder, show the cluster's reach in each language market. No spreadsheet.
That matters because growth can be uneven. A cluster written in English can climb in the UK while it stalls in Australia, and a rank tracker set to one location sees only one of those.
The average position trap in a merged view
Google's Performance report help defines average position as "the topmost position occupied by a link to your property or page in search results, averaged across all queries." Merge countries and the average runs across every search in all of them. The market with the most searches pulls hardest.
A worked example, with made-up numbers. In one week your cluster gets 9,000 impressions in the US at an average position of 12, 600 in Germany at 31 and 150 in Austria at 28. Weighted by impressions, the merged view reads about 13.4. Then Germany slides from 31 to 40. The merged number moves to about 14.0. A nine-place drop in your second market shows up as six tenths of a position.
Clicks and impressions add up honestly, because they're counts. Position and CTR are ratios, and ratios blur when you merge. So group markets that are close in size and language, and give any market you're investing in a filter of its own. We read average position with the same care for other reasons too, covered in why average position no longer maps to a rank.
How to set up market groups for a cluster
- Filter to the cluster's folder first. Use a page filter with "URLs containing" and the folder path. Google's help warns that filtering by query or URL "can affect the report totals due to data truncation and the omission of anonymized queries," so one folder filter beats a long list of query filters.
- Add the country group. Tick the markets that share a language and a sales team. Keep a big market and a small one apart.
- Record the baseline this week. Clicks, impressions and average position per group, for full Monday-to-Sunday weeks, with the date. Do it before the next page in the cluster ships.
- Read counts before position. Impressions up and position flat means the cluster reaches more searches. Position down with flat impressions in one group is the case worth opening.
- If you pull data by API, do the math yourself. Request the country dimension, sum clicks and impressions, and weight position by impressions: multiply each country's position by its impressions, add those up, divide by total impressions. Google hasn't published how the merged view computes it, so treat yours as a close estimate and track the trend.
What to do this week
Open the Performance report, set the folder filter for your biggest cluster, and save one view per market group. Write down this week's clicks, impressions and position for each. It takes ten minutes, and from then on a drop in a single-location tracker has a per-market Search Console line to be checked against.
The day one market moves and the others don't, you'll see it in the group that moved, instead of losing it in a global average.
If you want help setting up market-by-market tracking for your clusters, that's the kind of work we do at vibhe.


